

Are you a new member? Sign up now
Login area
| Sign up
Let us help you
Read about the latest topics.
Read about the latest topics.


المؤشرات الصحية
The Health Indicators provide concise information of the health situation and trends, including responses at national and global levels. They reflect indicators of relevance for country, regional and global reporting across the full spectrum of global health priorities. This section includes an excerpt of a country-tailored list for monitoring health status in Lebanon. This list will be a “dynamic entity”, updated periodically as more indicators are added, technologies develop and new priorities emerge. The following summary tables represent the best available country estimates of some indicators:,
Estimated Resident Population
Demographic and Socioeconomic Determinants
| 2010 | 2011 | 2012 | 2013 | 2014 | 2015 | 2016 | 2017 | 2018 | 2019 | 2020 | 2021 | 2022 | 2023 | 2024 | |
|---|---|---|---|---|---|---|---|---|---|---|---|---|---|---|---|
| Resident Lebanese Population('000) | 3,962 | 4,036 | 4,104 | 4,168 | 4,231 | 4,292 | 4,356 | 4,421 | 3,864* | 3,910* | 3,944* | 3,966* | 3,989* | 3,989* | 4,044* |
| Number of Registered Lebanese Births(MOI) | 91,795 | 97,887 | 90,167 | 86,950 | 88,704 | 85,453 | 88,996 | 90,647 | 89,772 | 86,179 | 74,049*** | 68,130*** | 62,868*** | 66,866*** | 65,209*** |
| Number of Registered Lebanese Deaths(MOI) | 21,441 | 23,257 | 22,792 | 23,414 | 25,117 | 25,275 | 24,617 | 25,847 | 25,096 | 24,950 | 28,637*** | 34,725*** | 29,455*** | 26,284*** | 26,715*** |
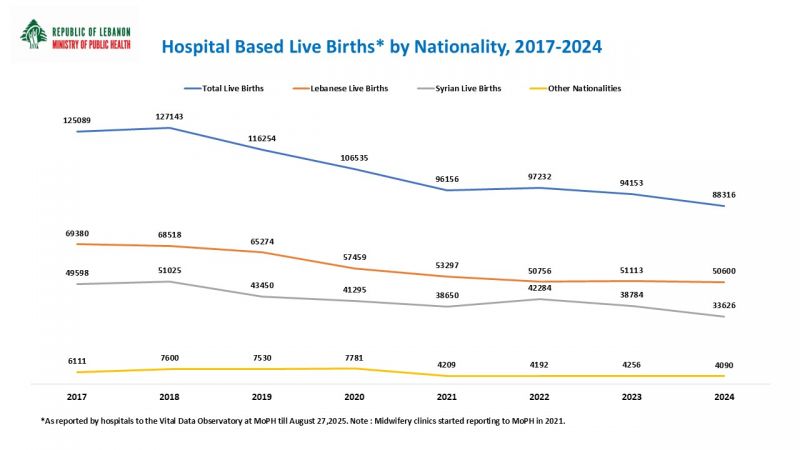
| Number of Hospital Live Births**(VDO-MoPH) | - | 77,341 | 79,605 | 89,379 | 105,348 | 110,416 | 114,627 | 124,597 | 127,143 | 116,254 | 106,535 | 96,156 | 97,232 | 94,153 | 88,316 |
| Number of Hospital Lebanese Live Births** (HMS-MoPH) | 71,016 | 69,380 | 68,518 | 65,274 | 57,459 | 53,297 | 50,756 | 51,113 | 50,600 | ||||||
| Number of Births (Lebanese adolescent women aged 15-19 years) | - | - | - | - | - | - | - | 2,771 | 2,659 | 2,322 | 1,767 | 1,692 | 1,704 | 1,524 | 1,469 |
| Total Fertility Rate (Lebanese women aged 15-49 years) | - | - | - | - | - | - | - | 1.8 | |||||||
| Number of Hospital Deaths ** (HMS-MoPH) | 18,145 | 18,226 | 18,747 | 21,197 | 27,583 | 21,939 | 20,210 | 22,957 | |||||||
| Number of Hospital Lebanese Deaths ** (HMS-MoPH) | 15,574 | 15,412 | 16,084 | 18,224 | 23,747 | 18,509 | 16,981 | 19,801 |
*Lebanese Population Estimate based on latest CAS survey results (Labor Force and Household Living Conditions Survey - LFHLCS 2018)
**Including Non-Lebanese
*** as on 02/05/2025
**Including Non-Lebanese
*** as on 02/05/2025
Risk Factors
| Unit | 2011 | 2012 | 2013 | 2014 | 2015 | 2016 | 2017 | 2018 | 2019 | 2020 | 2021 | 2022 | 2023 | 2024 | |
|---|---|---|---|---|---|---|---|---|---|---|---|---|---|---|---|
| Low Birth Weight ( less than 2500g) | % Total LiveBirths | - | - | - | - | - | 9.37 | 9.44 | 9.01 | 9.01 | 8.98 | 10.32 | 10.83 | 10.55 | 9.96 |
| Cesarean Delivery Rate | % | 46.1 | 47.6 | 46.5 | 45.6 | 46.7 | 47 | 47 | 47.5 | 49.5 | 48.3 | 50.2 | 49 | 51.1 | 54.9 |
Source:VDO-MoPH
Life Expectancy and Mortality
| 2012 | 2013 | 2014 | 2015 | 2016 | 2017 | 2018 | 2019 | 2020 | 2021 | 2022 | 2023 | 2024 | |
|---|---|---|---|---|---|---|---|---|---|---|---|---|---|
| Life expectancy at birth - Males | 80.27 | - | - | - | - | - | - | - | - | - | - | - | - |
| Life expectancy at birth - Females | 82.11 | - | - | - | - | - | - | - | - | - | - | - | - |
| Life expectancy at birth - Total | 81.24 | - | - | - | - | - | - | - | - | - | - | - | - |
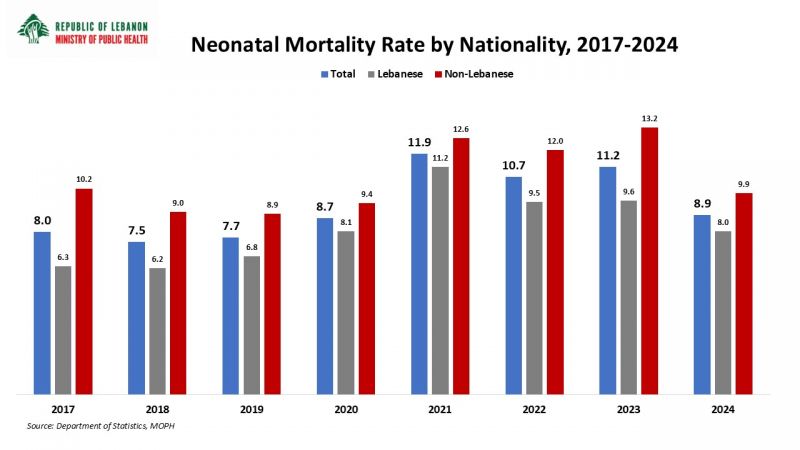
| Neonatal mortality rate per 1000 live births(HMS) | - | - | - | - | - | 8 | 7.5 | 7.7 | 8.7 | 11.9 | 10.7 | 11.2 | 8.9 |
| Maternal mortality ratio per 100 000 live births | 18 | 18 | 9 | 13.6 | 21 | 16.9 | 13.4 | 13.7 | 16.9 | 46.8 | 18.5 | 25.5 | 23.78 |
Morbidity
| Chronic conditions | Prevalence |
|---|---|
| Cardiovascular diseases, atherosclerosis, coagulation problems and hypertension | 47% |
| Diabetes | 15% |
| Ulcers | 10% |
| High cholesterol level | 10% |
| Other diseases (Rheumatism, uric acid, glaucoma, osteoporosis...) | 8% |
| Diseases of the nervous system | 3% |
| Epilepsy | 3% |
| Thyroid Problems | 2% |
| Asthma | 2% |
*For previous years check the Statistical Bulletins' page
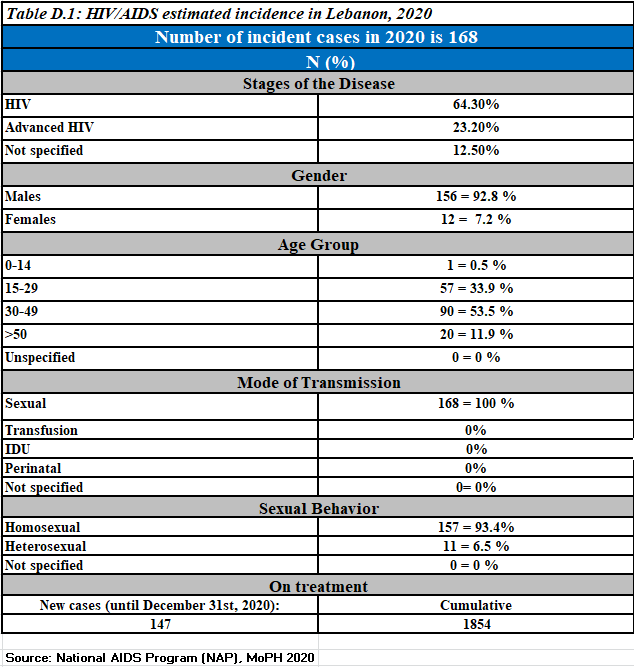
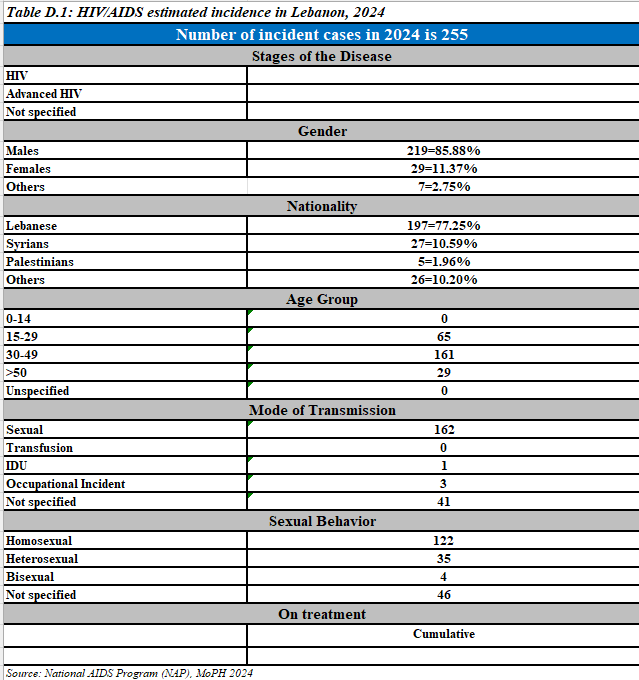
Newly reported HIV cases, 2020
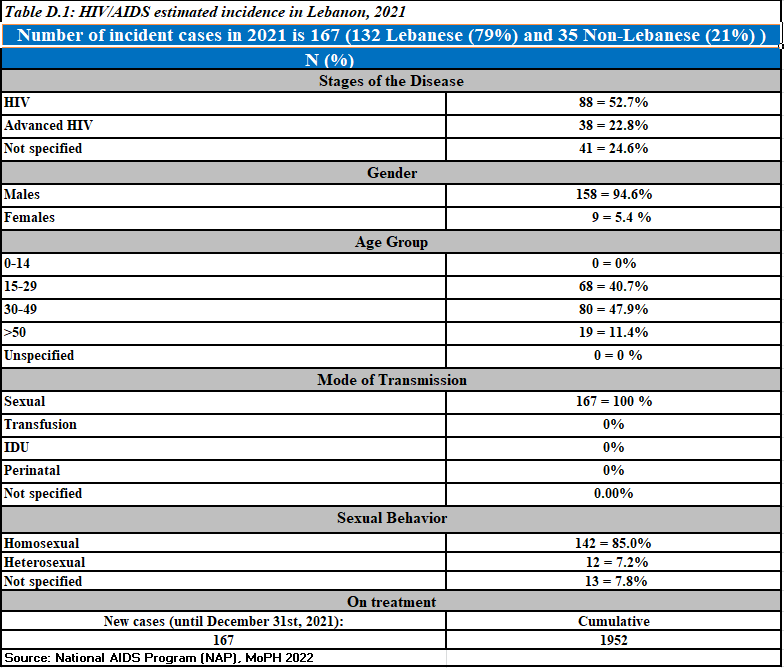
Newly reported HIV cases,2021
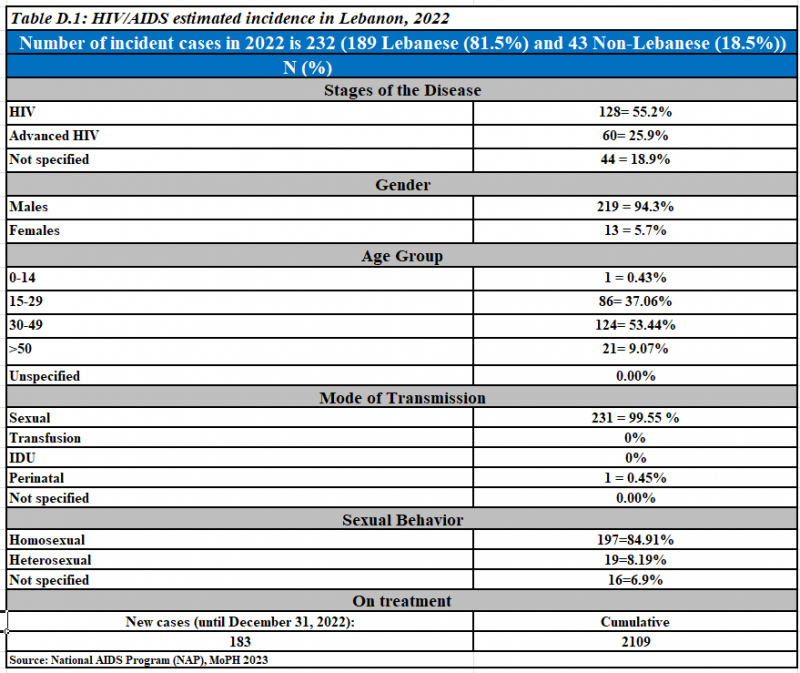
Newly reported HIV cases, 2022
Newly reported HIV cases, 2020
Newly reported HIV cases,2021
Newly reported HIV cases, 2022
.PNG)
Number of Measles cases
|
|
2012
|
2013
|
2014
|
2015
|
2016 | 2017 | 2018 | 2019 | 2020 | 2021 | 2022 | 2023 |
|---|---|---|---|---|---|---|---|---|---|---|---|---|
|
Measles
|
9
|
1,760
|
235
|
39
|
44 | 126 | 952 | 1070 | - | 28 | 95 | 351 |
Number of Tuberculosis cases*
| Tuberculosis cases | 2012 | 2013 | 2014 | 2015 | 2016 | 2017 | 2018 | 2019 | 2020 | 2021 | 2022 | 2023 | 2024 |
|---|---|---|---|---|---|---|---|---|---|---|---|---|---|
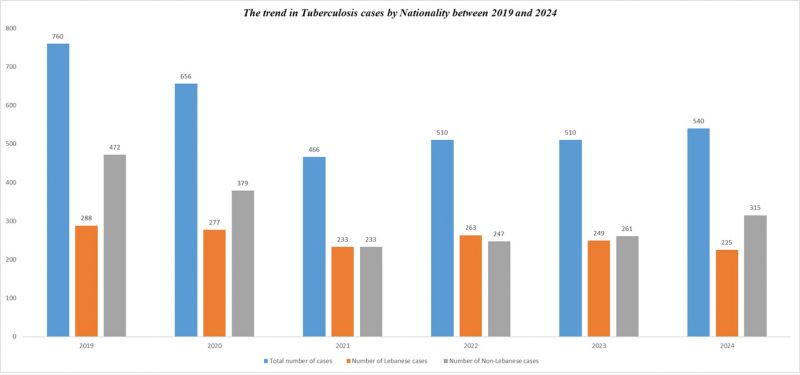
| Total number of cases | 630 | 689 | 682 | 666 | 657 | 632 | 668 | 760 | 656 | 466 | 510 | 510 | 540 |
| Number of Lebanese cases | 330 | 341 | 337 | 312 | 305 | 271 | 254 | 288 | 277 | 233 | 263 | 249 | 225 |
| Number of Non-Lebanese cases | 300 | 348 | 345 | 354 | 352 | 361 | 414 | 472 | 379 | 233 | 247 | 261 | 315 |
*MOPH National Tuberculosis Program 01/05/2025
The trend in Tuberculosis cases by Nationality between 2019 and 2024
The trend in Tuberculosis cases by Nationality between 2019 and 2024
.jpg)
.png)
.PNG)

Service Delivery
Number of Hospitals contracted by the MOPH by Mohafazah and Type, 2017*
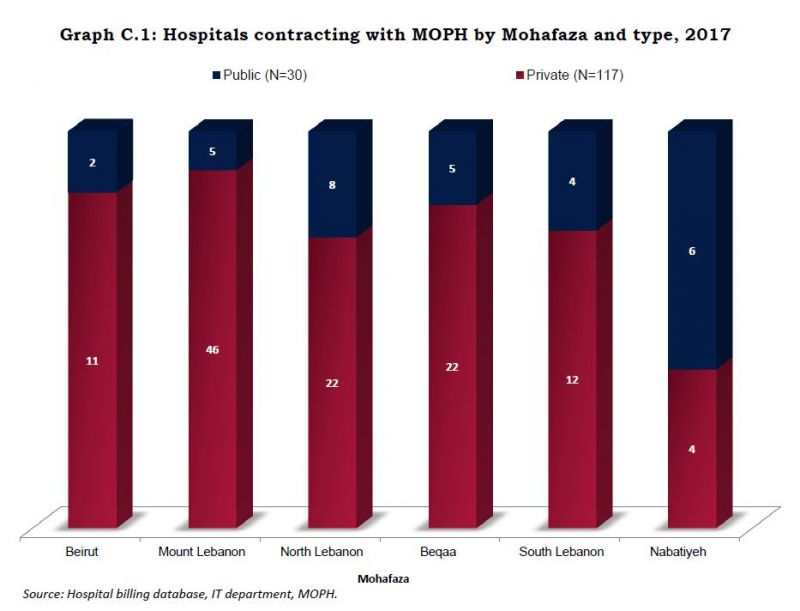
*For previous years check the Statistical Bulletins' page
Number of Admissions Subsidized by the MOPH by Qada, 2017*
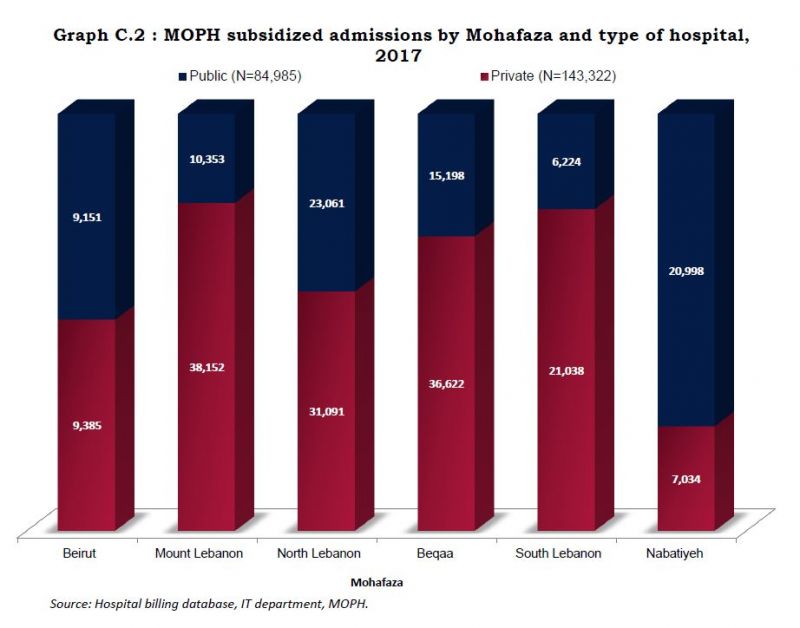
*For previous years check the Statistical Bulletins' page
*For previous years check the Statistical Bulletins' page
Number of Admissions Subsidized by the MOPH by Qada, 2017*
*For previous years check the Statistical Bulletins' page
Number of In-Patients Subsidized by the MOPH by Qada and hospital type, 2017*
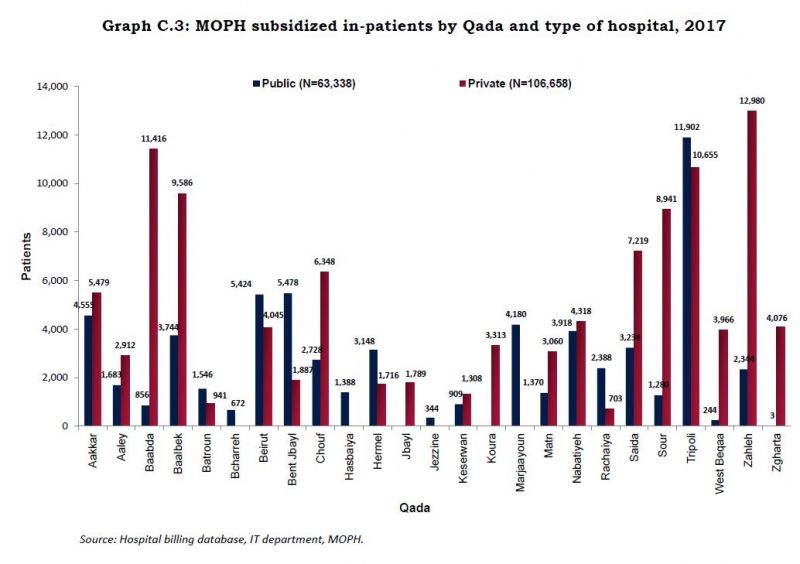
*For previous years check the Statistical Bulletins' page
*For previous years check the Statistical Bulletins' page
Health Expenditure
| Unit | 2015 | 2016 | 2017 | 2018 | 2019 | |
|---|---|---|---|---|---|---|
| Budget of the MOPH | Billion LBP | 515.9 | 642.7 | 708.5 | 728 | 743 |
| Per capita total expenditure on health (THE) | $US | 863 | - | - | - | - |
| Out-of-pocket expenditure as % of THE | Percent | 32.7 | - | - | - | - |
Health Workforce
| Unit | 2012 | 2013 | 2014 | 2015 | 2016 | 2017 | 2018 | 2019 | 2024 | |
|---|---|---|---|---|---|---|---|---|---|---|
| Physicians | per 10,000 population | 36.5 | 31.9 | 30.7 | 32.0 | 31.0 | 31.3 | 31.2 | 33.3 | 44.8 |
| Nursing and Midwifery | per 10,000 population | 29.1 | 33.1 | 33 | 33.4 | 34.2 | 36.4 | 37.4 | 38.6 | 63.2 |
| Dentists | per 10,000 population | 12.7 | 12.6 | 12.9 | 12.9 | 15.1 | 15.2 | 15.6 | 15.6 | 20.4 |
| Pharmacists | per 10,000 population | 18.6 | 16.8 | 17.5 | 17.7 | 18.2 | 18.9 | 19.8 | 20.3 | 28.5 |
Medicines and Medical devices
Density per million population of high tech equipment
| High tech unit | N* |
|---|---|
| Open heart surgery departments | 27 |
| Cardiac catheterization laboratories | 59 |
| Kidney transplant centers | 8 |
| Bone marrow transplant units | 6 |
| Specialized burns centers | 3 |
| CT scan machines | 110 |
| MRI machines | 41 |
| PET scan | 7 |
| Dialysis machines | 841 |
*High tech equipment in the public and private sector
*Number as provided by the Department of Projects and Programs in 2014 pertaining to the latest available figures (2012)
*Number as provided by the Department of Projects and Programs in 2014 pertaining to the latest available figures (2012)
Service Coverage
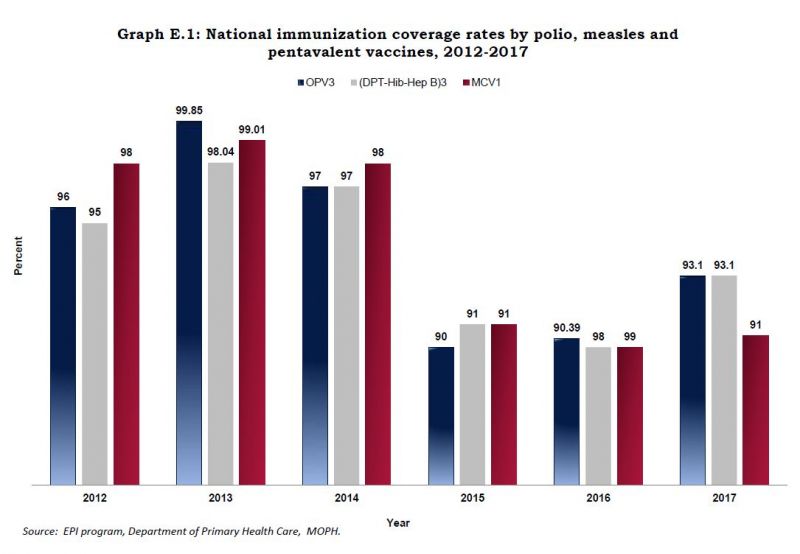
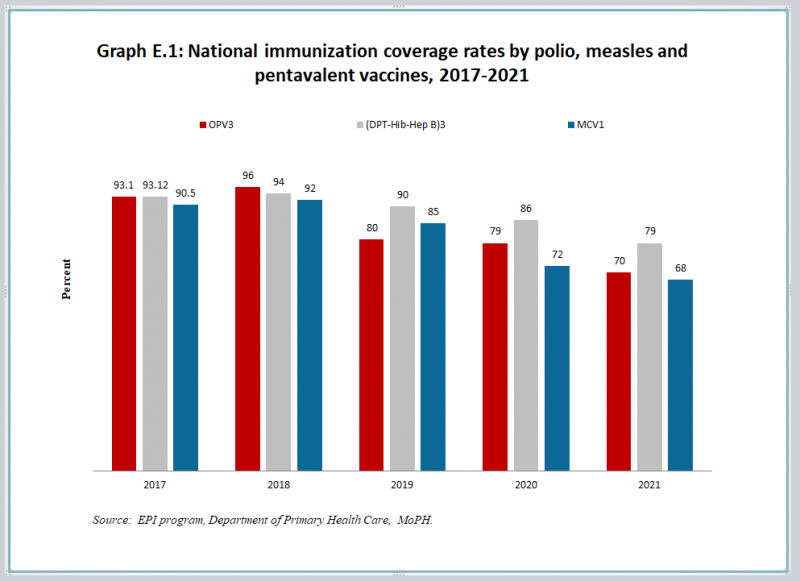
National immunization coverage rates by polio, measles and pentavalent vaccines, 2012-2017
*For previous years check the Statistical Bulletins' page
.PNG)
Sitemap 
© Copyrights reserved to Ministry of Public Health 2026